

Retention metrics: the survivor bias and cohort retention
How to get a true reflection of customer loyalty over time.

At their core, all retention metrics assess one thing: do customers keep using your product?
There are two types of retention we can measure: aggregate (overall) retention and cohort retention.
Aggregate vs cohort retention
Aggregate retention is a broad measure of how well a business retains its customers over a period of time. You can find it in Shopify under “Returning Customer Rate”.
It’s calculated as the percentage of customers who engage with your business or make repeat purchases within a specific timeframe.
While this offers a quick snapshot of customer loyalty across all segments, it doesn’t account for differences in behavior between newer and older customer groups.
Using aggregate retention alone can lead to survivor bias—where the metric is skewed by older, loyal customers while masking churn among newer cohorts.
Let me explain.
Imagine you have two groups of customers, "good" and "bad".
The good ones stay with you 70% of the time, and the bad ones only 20% of the time.
Let's say you start with 500 in each group. After a year, you'd expect to keep 350 of the good customers (because 70% of 500 is 350) and only 100 of the bad ones (since 20% of 500 is 100).
As time goes on, this pattern continues.
You keep losing more of the bad customers and retaining more of the good ones.
This changes the makeup of your customer base – there are more "good" customers over time and your overall retention rate might look like it's improving – it could go from 45% to 70% in five years.
But this increase isn't because each customer is more likely to stay.
It's because the group of customers who are naturally more likely to stay (the good ones) is becoming a bigger part of your overall customer base. This is the "survivor bias".
The customers who are naturally more likely to stick around are increasingly dominating your customer base, making your retention rates look better than they really are.
Therefore it's best to track retention rates for groups based on when they made their first purchase (cohorts).
Let's explore how it applies to a DTC subscription model.
How to analyze cohort retention
The most common form of retention for a DTC subscription brand is order retention.
Let’s assume 1000 people signed up for your product for a monthly subscription in January.
We’ll refer to them as the “January Cohort” (i.e., the people who signed up in January).
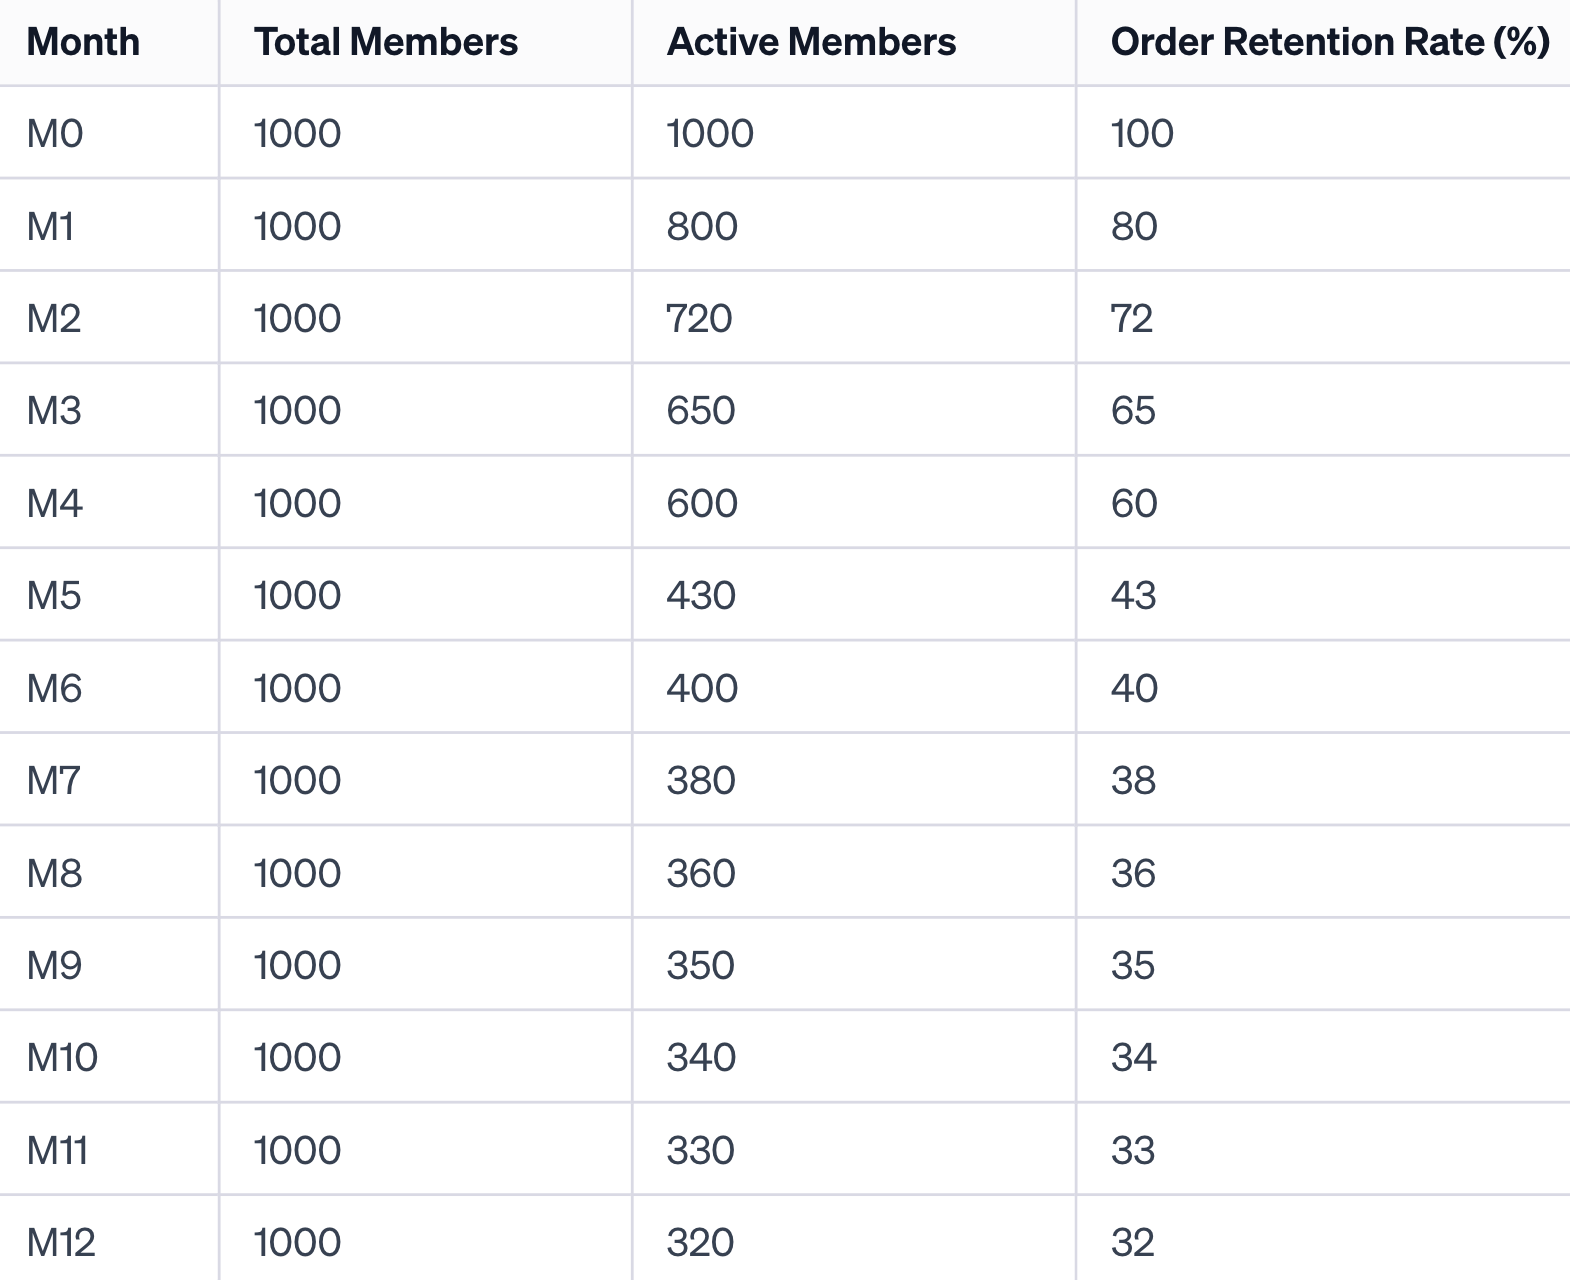
In Month 0 (M0), the January Cohort consists of all 1000 members who initially signed up. This is our starting point for tracking retention.
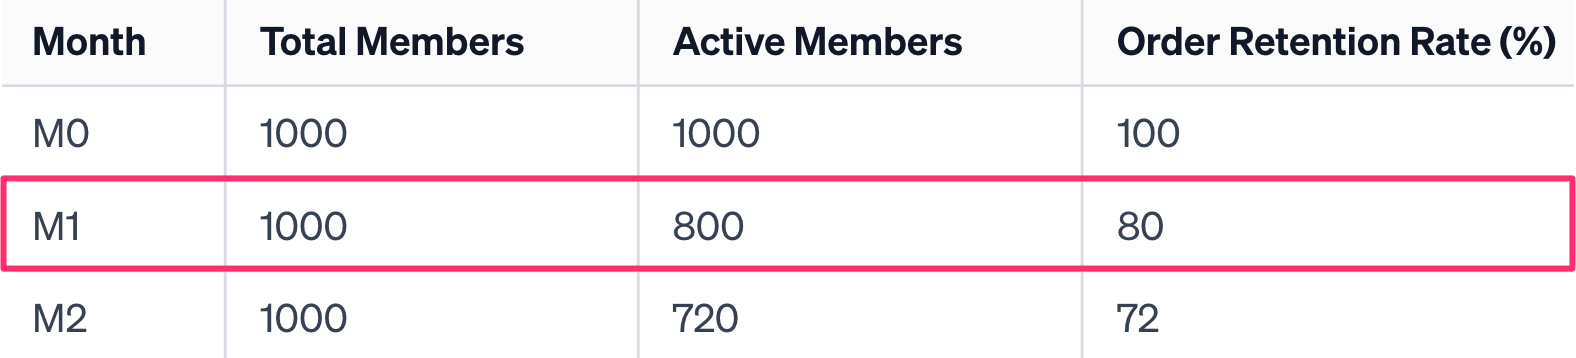
As we move into the first month (M1), 800 of these members make another purchase.
This means that our order retention rate for the January Cohort in M1 is 80% (800/1000).
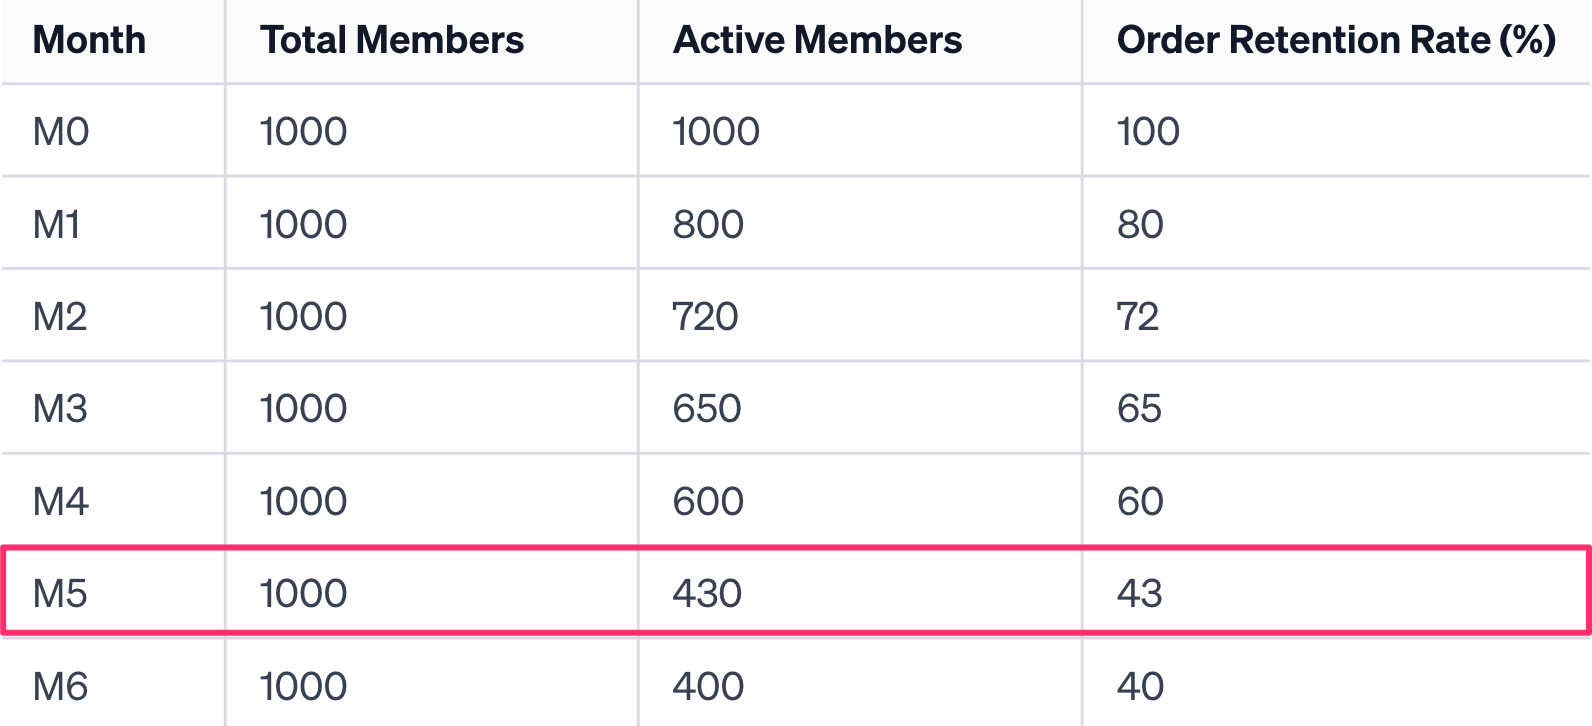
Fast forward to the fifth month (M5), and 430 members are still actively purchasing.
This translates to an order retention rate of 43% for the January Cohort at M5.
Now, let's take a closer look at the retention rates as we progress further.
Interestingly, as we reach the twelfth month (M12), the retention rate remains steady from the eleventh month (M11), indicating a stabilization in customer retention.
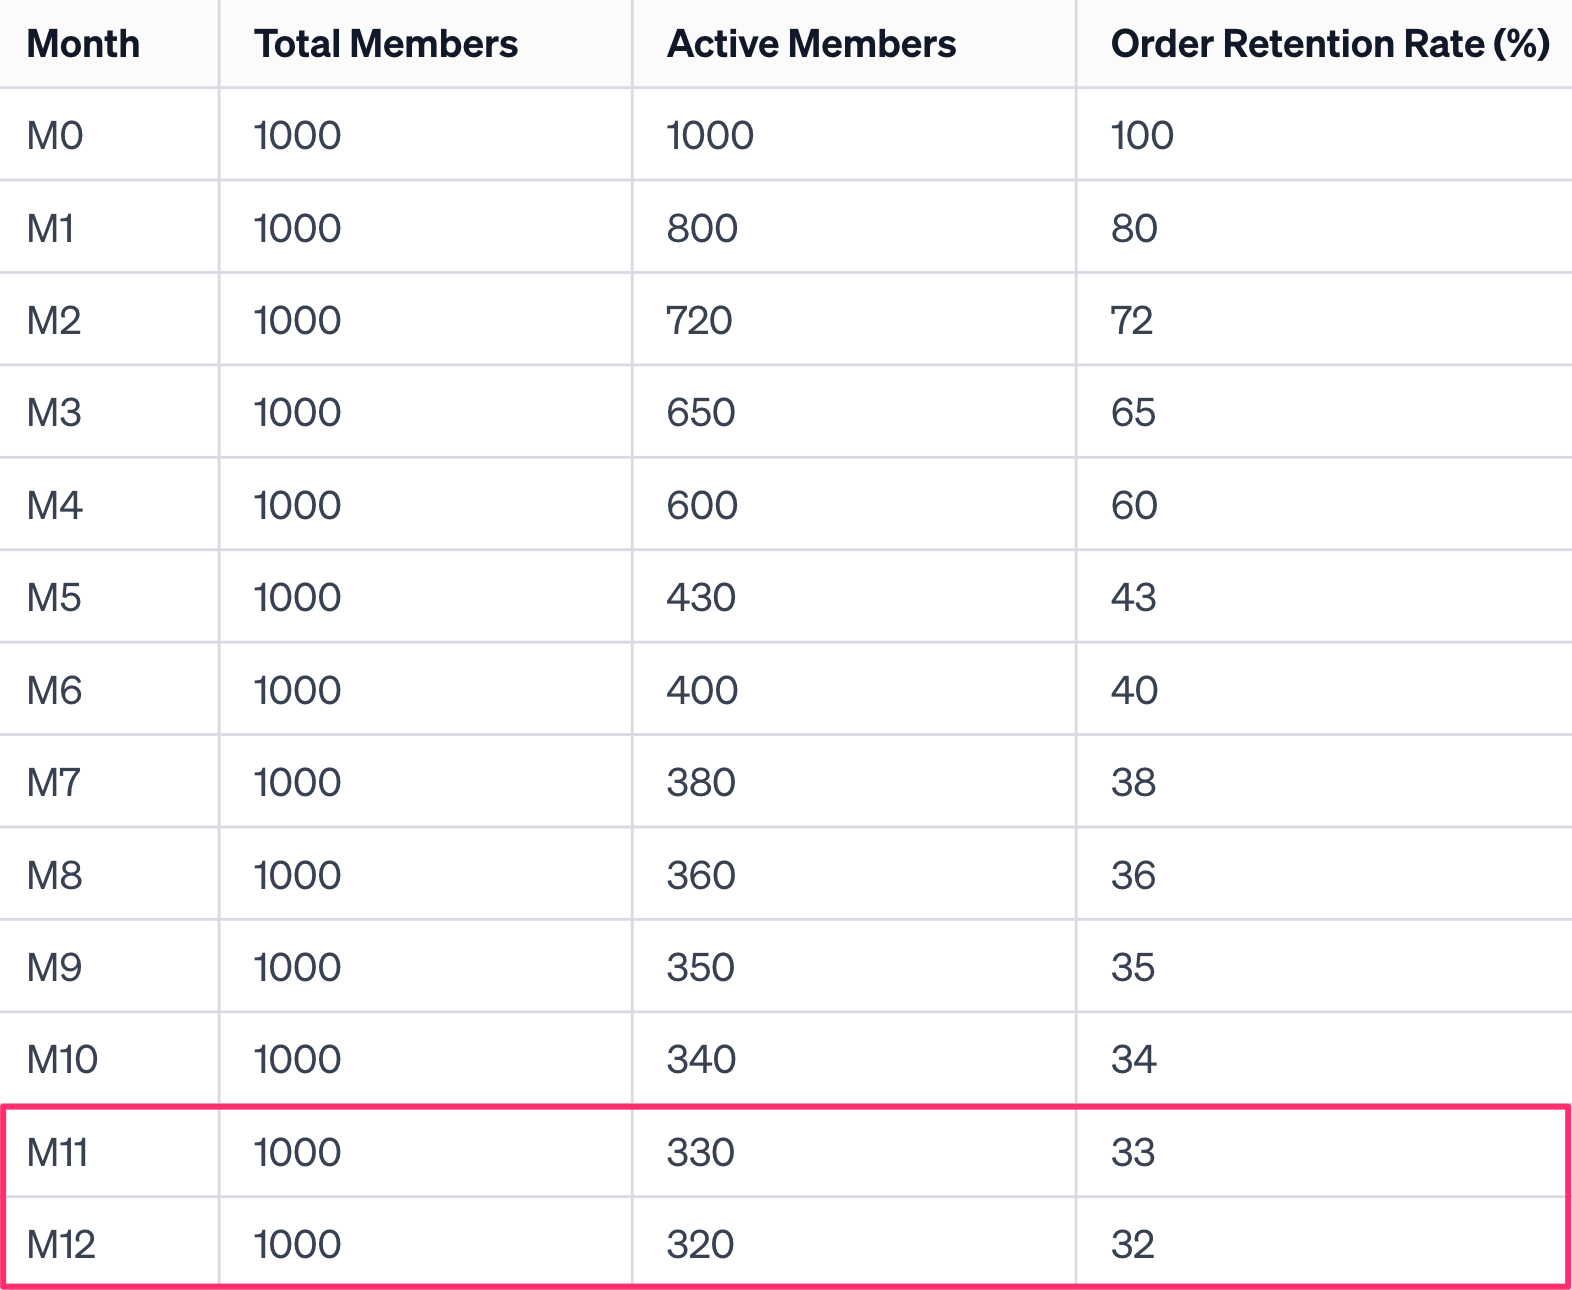
This steady retention rate might hint at a loyal customer base that's found value in the subscription, leading us to hope for a steady or increasing retention rate in the thirteenth month (M13).
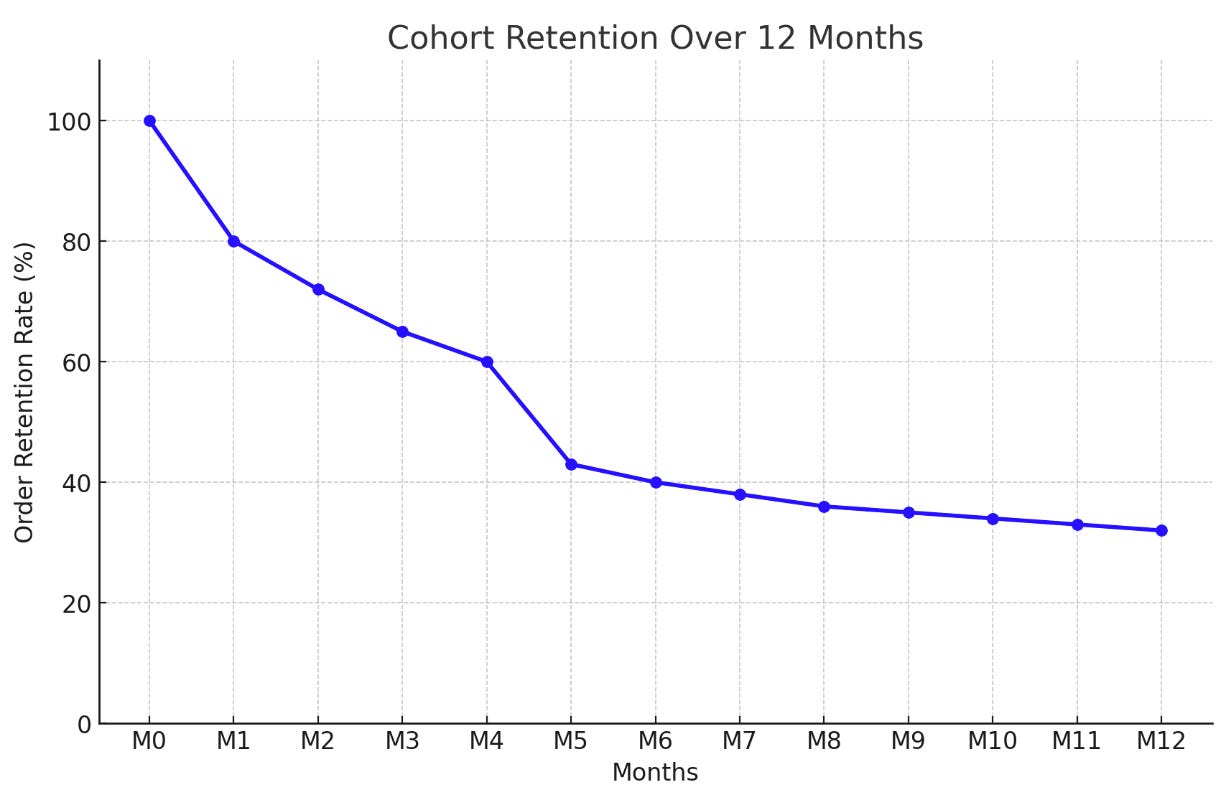
Graphs like this provide a clear view of how the retention rate changes over time for the cohort, highlighting the pattern of decline and stabilization.
But here's where things get even more intriguing.
You can go one step further and slice the data differently, to uncover deeper insights into which types of customers retain the best.
For instance, we can analyze the January Cohort by subscription plans and acquisition sources.
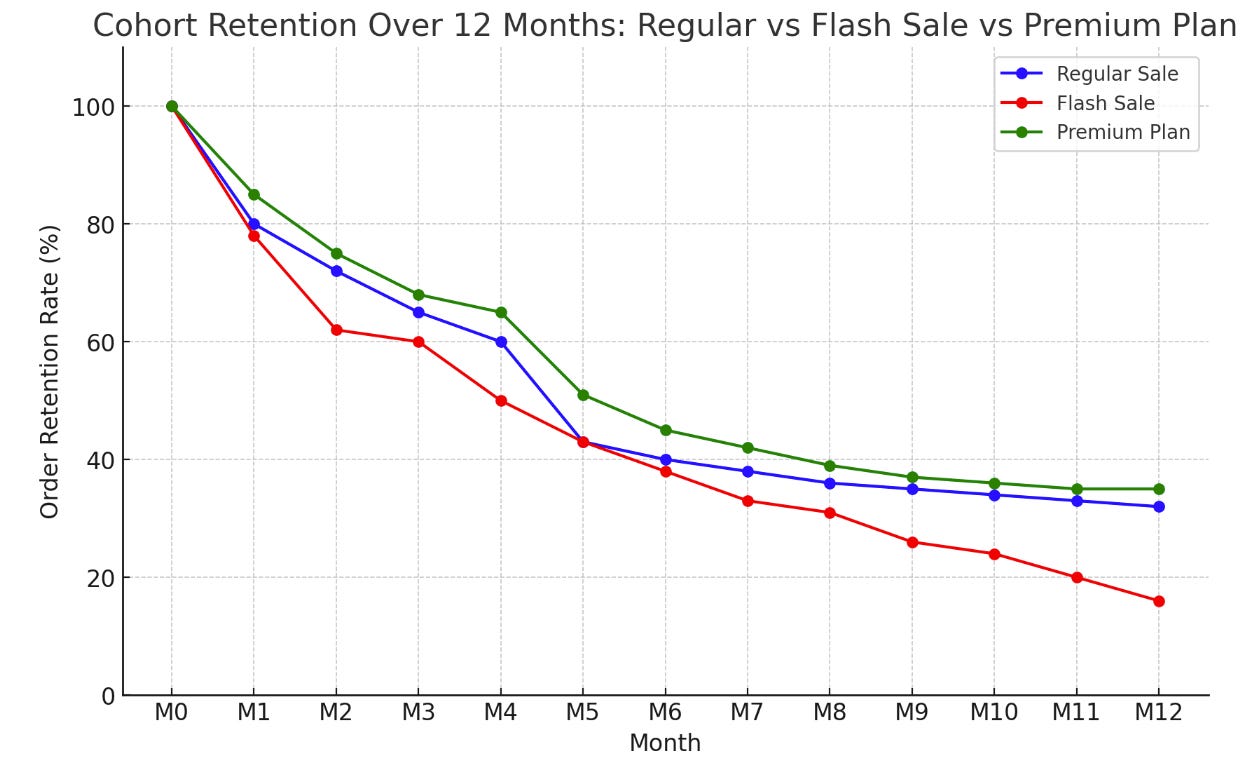
Members who subscribed to the Premium Plan show a slower decline in retention compared to the general cohort.
By the twelfth month (M12), they maintain a higher retention rate, reflecting their sustained engagement and satisfaction with the service.
This highlights the Premium Plan's effectiveness in fostering long-term customer loyalty.
In contrast, customers acquired through the Flash Sale Campaign demonstrate a markedly quicker decline in retention.
Their retention rate drops significantly faster than the average, indicating that while such campaigns might be effective in attracting new sign-ups, they pose challenges in sustaining long-term customer engagement.
This raises important considerations for balancing the allure of short-term gains against the need for lasting customer relationships.
Wrapping up
I hope you can see now why segmenting your customer base and understanding the different behaviors and preferences within each segment is so valuable.
By identifying the characteristics of our most loyal subscribers, you can tailor your marketing and product development strategies to better meet their needs and preferences, thereby enhancing customer satisfaction and loyalty.
Thanks for reading,
Marcin
Really enjoyed this. Would be great to read about the foundations of a growth marketing framework for SMEs/startups